Report Overview
Soft Drinks Market Report, Highlights
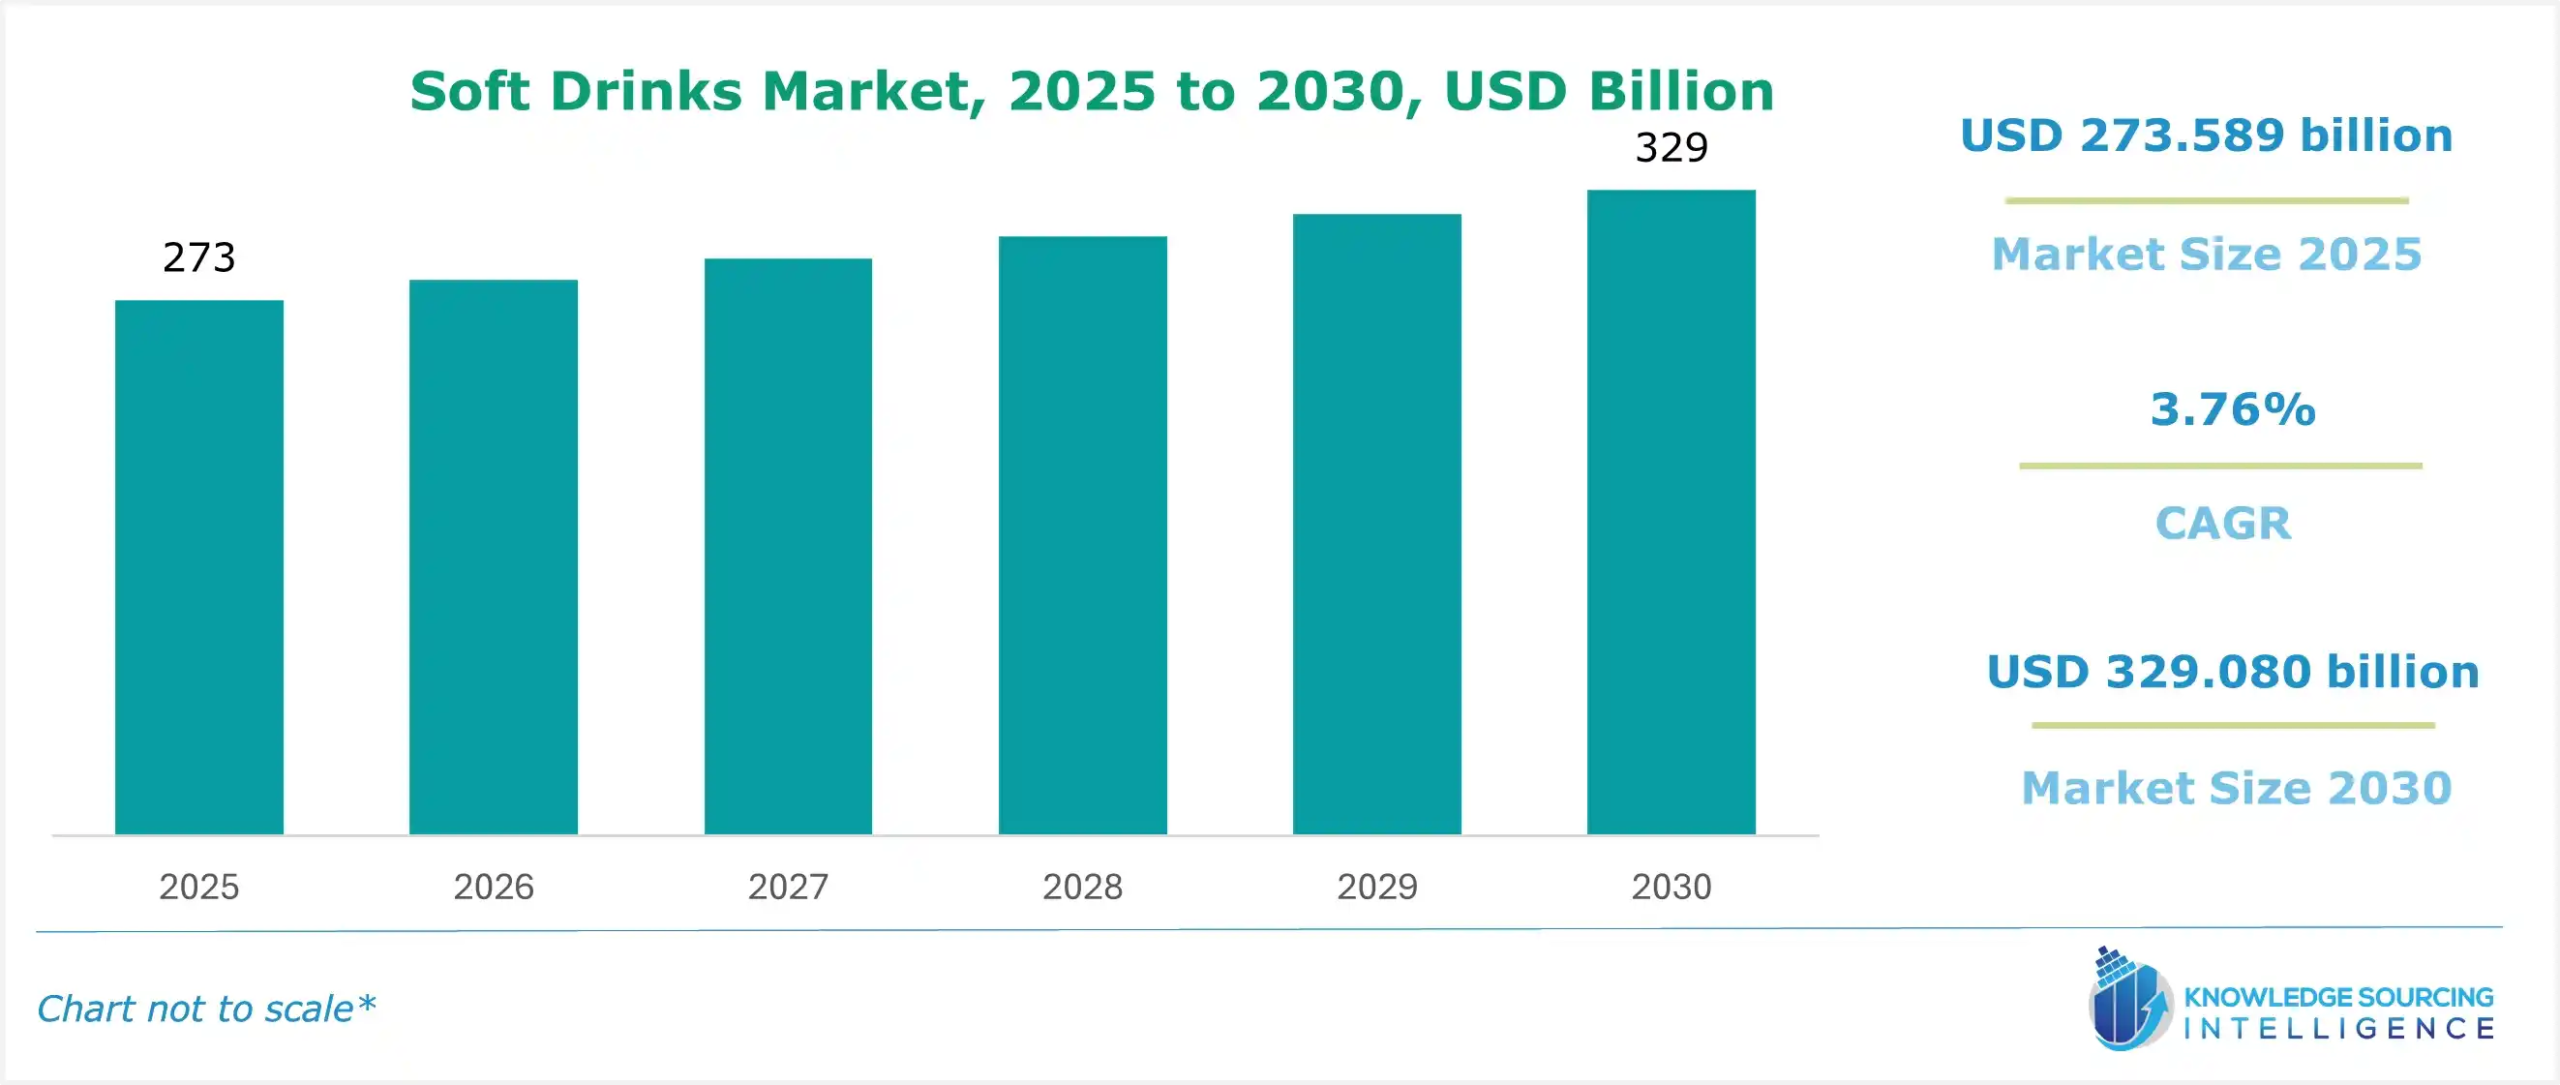
Soft Drinks Market Size:
The soft drinks market is estimated to grow at a CAGR of 3.76% to reach USD 329.080 billion in 2030 from USD 273.589 billion in 2025.
Soft Drinks Market Trends:
Over the next years, market development is anticipated to be aided by rising disposable incomes, changing lifestyles, and an expanding population. Additionally, it is anticipated that millennial popularity and increased R&D spending in the food and beverage business would fuel industry demand. Consequently, major players are witnessing high profits in the market. For instance, for the fiscal year that ended on March 31, 2022, RRVL recorded consolidated sales of 199,704 crores ($ 26.3 billion) and a net profit of 7,055 crores ($ 931 million). The purchase of the Campa brand was a component of Reliance's plan to expand its FMCG division and give it a clear focus through the creation of its private labels as well as the purchase of formerly well-known regional brands.
Key players have been focusing on product launches and innovations. For instance, in June 2023, Bisleri International, India's leading packaged drinking water brand and the country's first manufacturer of carbonated soft drinks (CSD), introduced three new, enticing flavors: Bisleri Pop (a carbonated drink with an orange flavor), Bisleri Rev (a carbonated drink with a cola flavor), and Bisleri Spyci Jeera. The new lineup of fizzy drinks captures Gen Z's contemporary palate and the quest for the most refreshing flavor. Each beverage has a distinctive flavor that is powerful and goes well with the functional stimulus.
In May 2022, to replace the legendary brands that had abandoned the Russian market in the aftermath of its invasion of Ukraine, a Russian beverage manufacturer introduced a new line of soft drinks. Russian drink manufacturer Ochakovo stated that CoolCola, Fancy, and Street will be available to consumers in place of Coca-Cola, Fanta, and Sprite. Since the Coca-Cola Company discontinued operations in Russia, the three international soda brands have been mostly absent from Russian store shelves. While Coca-Cola products are still available in stores, their costs have soared since the ban by almost 200%.
To draw in more customers, major manufacturers are continuously experimenting with new flavors and innovations for zero-calorie beverages. For instance, PepsiCo announced the reopening of the Pepsi-Cola Soda Shop in October 2022 with the introduction of a new, limited-edition flavor called Zero-Sugar Cream Soda Cola. As customers look for low-calorie choices, the demand for goods with lower sugar content is rising. Some nations employ budgetary measures, such as raising taxes, to lower the consumption of sugary beverages.
Soft Drinks Market Growth Drivers:
- Continuous product developments
Over the forecast period, it is anticipated that new product releases will continue to be a top strategy for industry players. In November 2022, NourishCo Beverages, a 100% subsidiary of Tata Consumer Products Ltd (TCPL) and the manufacturer of Himalayan packaged water, premium honey and preserves, and ready-to-serve fruit drinks, is betting on the unorganized nature of the beverages market in India and plans to introduce products that satisfy regional tastes while standing out from the competition in terms of innovation.
Moreover, companies are adopting strategies to entice a younger generation of tech-savvy customers. For instance, in April 2022, Zero Sugar Byte, a limited-edition beverage from Coca-Cola, is said to have "the flavor of pixels," according to the company. It is inspired by the gaming industry, namely the online video game Fortnite, and the metaverse (the collective term for 3D virtual worlds that stimulate social engagement).
- New Flavors
Firms are continuously working on their own version of differentiated flavors to increase their market share in the highly competitive soft drinks industry. In March 2023, for example, Nestlé announced that it would soon introduce a coffee-lemonade-hybrid soft drink. It has applied to the Intellectual Property Office to register the term "Coffeenade" under two classes: class 32, which covers lemonades and fizzy beverages with a coffee taste, and class 30, which covers coffee-based beverages and iced coffee.
Similarly, in January 2023, a new soft drink with a lemon-lime taste named STARRY was introduced by PepsiCo. It is being made available at shops and food service establishments across the US in Regular and Zero Sugar varieties. In addition, in January 2023, a new flavor was introduced by UK startup ZAG Drinks to expand its menu. With ZAG ICE, a new non-alcoholic beverage line created exclusively for adults during social gatherings, the category of adult soft drinks is given a revitalizing, fresh viewpoint.
Soft Drinks Market Segments Analysis:
- The carbonated drinks segment is anticipated to hold a significant market share in the forecasted period.
With rising disposable income & changing lifestyles of consumers, there is a shift in consumer food habits as well. The market players are primarily focusing on innovations in carbonated soft drink products to suit customers’ preferences. For instance, top players such as Sprite are focusing on introducing carbonated soft drinks with mixtures having adequate sugar levels, aspartame & acesulfame to cater to changing customer demand. Furthermore, according to Coca-Cola's latest annual report for 2022, the company witnessed huge growth in income from non-alcoholic beverages compared to 2021 income, as depicted below. This indicates favorable segment growth during the forecast period.
Moreover, the manufacturing & packaging of carbonated soft drinks is witnessing continuous changes at a fast pace. With mass production & improved packaging systems, the companies are able to generate more revenue. For instance, in 2022, Keurig Dr. Pepper, Inc. introduced specialization in marketing & production of a wide range of alcoholic & non-alcoholic beverages.
With the rapid growth of fast-food outlets, the demand for carbonated soft drinks has also increased manifold across various countries. For instance, the demand for carbonated soft drinks has increased in Domino’s, Pizza Hut, Burger King, and other quick-service restaurants. This is due to the fact that the majority of these meals are accompanied by a beverage, mainly soft drinks. These drinks help to enhance the flavor of fast food as well.
The rising demand in the food service industry for diet soft drinks will further lead to an increase in the production of carbonated soft drinks. The increasing awareness about healthcare-related issues has resulted in a boost in diet soft drinks worldwide. The rising concerns related to obesity & wellness among consumers are expected to impact the market growth in a positive manner till the forecast period. For instance, in 2021, PepsiCo announced its plans to bring a 25% reduction in added sugar levels by 2025 & further a 50% reduction by the year 2030 in beverages such as Pepsi Cola, Lipton iced tea & 7UP.
Soft Drinks Market Geographical Outlook:
- The North American region is expected to hold a major market share in the coming years.
This market is a highly competitive and dynamic industry. The United States is one of the largest consumers of soft drinks in the world, with a significant portion of its population regularly consuming these beverages. The market is dominated by well-established brands such as Coca-Cola, PepsiCo, and Dr. Pepper Snapple Group, which have a strong presence and offer a diverse portfolio of products.
Cola drinks, particularly Coca-Cola and Pepsi, hold a significant share of the soft drinks market. These iconic brands have loyal customer bases and engage in aggressive marketing and advertising campaigns to maintain their market dominance. However, in recent years, there has been a growing trend towards healthier alternatives, leading to the rise of low-calorie and diet sodas.
Shifts in consumer lifestyles and preferences have had a significant impact on the market. Consumers are increasingly seeking convenient and on-the-go beverage options to fit their busy routines. Soft drinks, especially bottled water, energy drinks, and ready-to-drink teas and coffees, cater to these evolving consumer needs. Moreover, soft drink companies are continuously innovating and introducing new products to attract consumers. They are expanding their product portfolios with new flavors, variations, and packaging designs. This constant innovation helps drive consumer interest and supports market growth.
On the other hand, increasing disposable income levels have a positive impact on the soft drinks market. As consumers have more purchasing power, they are more likely to spend on beverages, including soft drinks, as part of their daily routine and social activities. Moreover, technological advancements have enabled the development of new manufacturing processes, packaging solutions, and distribution channels. These advancements streamline operations, improve product quality, and enhance the overall efficiency of the soft drink industry.
Soft Drinks Market Key Developments:
- In August 2024, Coca-Cola teamed up with OREO to launch two innovative products: Coca?Cola® OREO™ Zero Sugar and OREO® Coca?Cola™ Sandwich Cookie. These inventions combine the iconic flavors and visual identities of the two brands into a playful and surprising expression for consumers. The packages are sleek, black-and-white designs that pay homage to the iconic equities of both Coca-Cola and OREO while including creative elements like OREO® cookie embossments and stacked Coca-Cola® bottle designs. This partnership shows that brands do their best to marry tradition with innovation, winning over faithful followers and thrill-seeking snackers.
List of Top Soft Drinks Companies:
- The Coca-Cola Company
- PepsiCo
- Dr. Pepper/Seven Up Inc.
- Asahi Group Holdings, Ltd.
- Kirin Holdings Company Limited
Soft Drinks Market Scope:
| Report Metric | Details |
|---|---|
| Study Period | 2021 to 2031 |
| Historical Data | 2021 to 2024 |
| Base Year | 2025 |
| Forecast Period | 2026 – 2031 |
| Report Metric | Details |
| Soft Drinks Market Size in 2025 | USD 273.589 billion |
| Soft Drinks Market Size in 2030 | USD 329.080 billion |
| Growth Rate | CAGR of 3.76% |
| Study Period | 2020 to 2030 |
| Historical Data | 2020 to 2023 |
| Base Year | 2025 |
| Forecast Period | 2025 – 2030 |
| Forecast Unit (Value) | USD Billion |
| Segmentation |
|
| Geographical Segmentation | North America, South America, Europe, Middle East and Africa, Asia Pacific |
| List of Major Companies in Soft Drinks Market |
|
| Customization Scope | Free report customization with purchase |
Soft Drinks Market Segmentation:
- By Type
- Carbonated
- Bottled Water
- Juice Drink
- Functional Drink
- Others
- By Packaging
- Bottles
- Canned
- Soda Fountain
- By Distribution Channel
- Online
- Offline
- By Geography
- North America
- United States
- Canada
- Mexico
- South America
- Brazil
- Argentina
- Others
- Europe
- United Kingdom
- Germany
- France
- Spain
- Others
- Middle East and Africa
- Saudi Arabia
- UAE
- Israel
- Others
- Asia Pacific
- Japan
- China
- India
- South Korea
- Indonesia
- Thailand
- Others
- North America